Like woolly socks for your brain, you almost feel warmer inside when you stare at an information radiator. There’s something about capturing the information that can bring a sense of calm. Even if the information paints a bad picture, at least it’s a picture you can see! You have reduced your known-unknowns.
Last year, our company made the move to Agile. The very word will conjure a variety of images for different people. For me, this sums it up:

But that aside, one of the pillars of Agile is about refining commitment and to do this you need to measure all the things. A vital part of understanding your throughput (or velocity) is having past information to hand. As a team I think it’s fair to say that our methods were a touch lo-Fi:

Yes, that is some scribblings on a whiteboard. However, it wasn’t the Art Attack nature of it that caused us to rethink; it was the fact that we have a cross-geo team. Short of setting up a permanent webcam a la the infamous Trojan Room coffee pot, our colleagues in India were not going to feel any the warmer for this information radiator.
Out with the old ‘n’ busted; in with the new shiny
We have now replaced Scribbles on a whiteboard with an interactive, browser-based, dashboard:
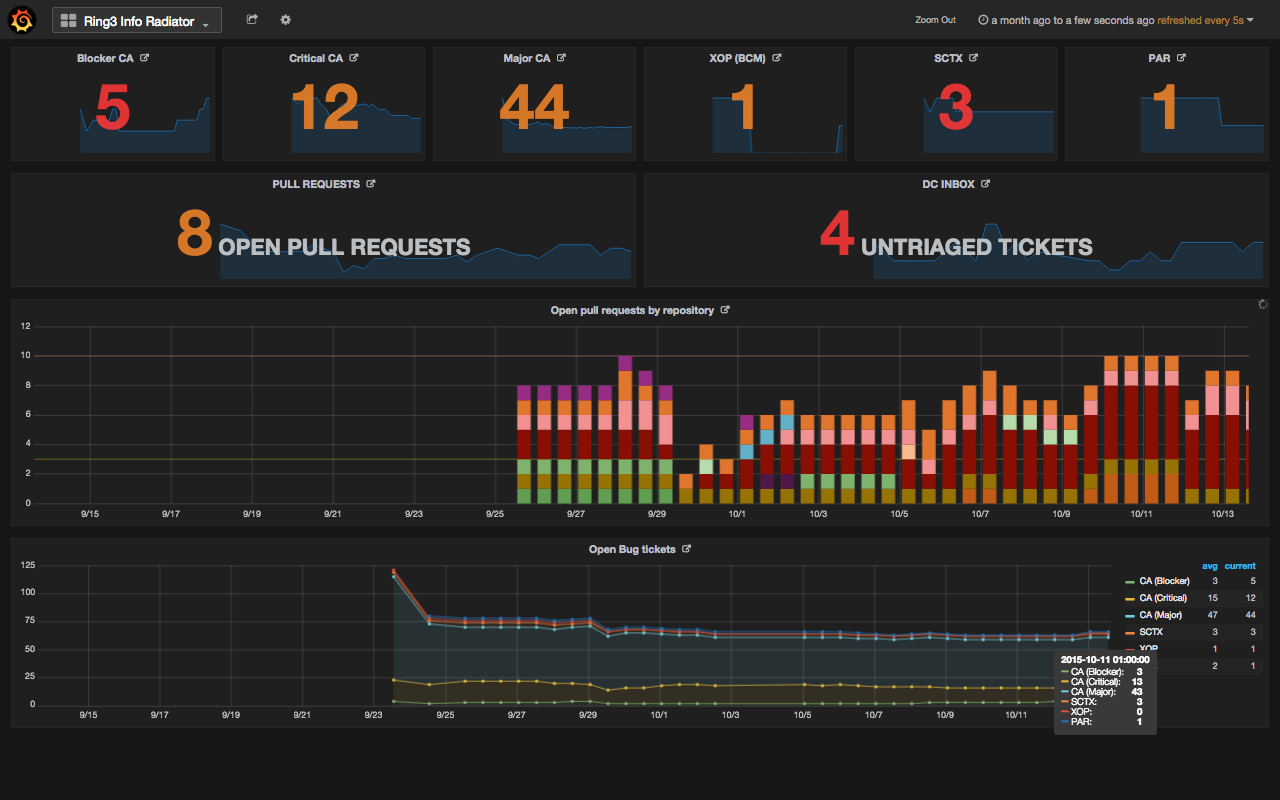
What you display is up to you, but we want to focus as a team on reducing two metrics: the number of open tickets and the number of open pull requests.
Now we have these numbers glowering at us every time we stand up from our desks on a 42” screen hanging from the ceiling. But, and just as importantly for our cross-geo colleagues, this dashboard can be accessed from anywhere on our intranet and displayed in a browser.
It’s a major win over Scribbles since it’s also quite interactive. If you hover over a section of a graph it will break down the points for you (as you can see in the bottom part of the screenshot). It’s also set up so that you can click on one of the numbers and it will take you to JIRA or Github for the open ticket numbers and pull requests respectively.
How does it all fit together?
The infrastructure for this dashboard is pretty simple. We basically have a NUC (think Raspberry Pi) running Fedora strapped to the back of a TV which runs the following:
- Some scripts to get the numbers;
- InfluxDB to store the numbers;
- Grafana to visualise the numbers in a feature-rich dashboard;
- Firefox in fullscreen mode to show the dashboard.
InfluxDB
InfluxDB is an open-source (✓), schema-less (✓), locally-hosted (✓), time-series database. It just worked out of the box after installation. They have packages for many distributions on their download page including for Mac. For us, installation was as simple as:
$ wget https://s3.amazonaws.com/influxdb/influxdb-0.9.4.2-1.x86_64.rpm
$ sudo yum localinstall influxdb-0.9.4.2-1.x86_64.rpm
$ sudo chkconfig influxdb on
$ sudo service influxdb start
Now we have the influxd daemon running. We can start throwing data at it.
Here we create a separate database, but you could just as easily use the
default one. Then we just write the data we want to store—no need for
a schema, it’s more of a JFDI database:
$ /opt/influxdb/influx
Connected to http://localhost:8086 version 0.9.4.1
InfluxDB shell 0.9.4.1
> CREATE database test
> USE test
Using database test
> INSERT cpu,host=serverA,region=us_west value=0.64
> SELECT * FROM cpu
name: cpu
---------
time                            host    region  value
2015-10-13T14:49:15.533599835Z  serverA us_west 0.64
It’s that simple. Queries are made made using InfluxQL which is straight-forward. InfluxDB’s Getting Started page is good place to start. They also draw up a comparison to SQL for those with an SQL background.
It also configures a web interface out of the box so you can make queries by
going to localhost:8083 in your browser and, more importantly for us, it
exposes an API over HTTP on port 8086 which we’ll use to record data from
our scripts.
Scripts to write to the database
Getting the data you want is up to you. Being an open-source project, one of
the things we wanted to record was the number of open pull requests to the
repositories we maintain as a team. To do this we wrote a python script
to find this information using Github’s REST API. Once we had our data
that we wanted to record it was a simple HTTP POST to put the data into
InfluxDB:
influx_uri = "http://localhost:8086/write?db=inforad"
tstamp = int(time.time()) * 10**9
try:
    for (repo, count) in counts.iteritems():
        data = "open_pull_requests,repo=%s value=%d %d" % (repo, count,
                                                            tstamp)
        resp = requests.post(influx_uri, data=data)
    data = "total_open_pull_requests value=%d" % len(pull_reqs)
    requests.post(influx_uri, data=data)
except requests.exceptions.ConnectionError:
    sys.stderr.write("error: Connection to local influxdb failed")
    sys.exit(5)
Configuring Grafana
Once Grafana is installed, there isn’t much configuration to do. By default it
binds to port 3000 but this can be changed either by changing the http_port
option in /etc/grafana/grafana.ini or by forwarding all requests on port 80
to port 3000:
sudo iptables -t nat -A PREROUTING -p tcp --dport 80 -j REDIRECT --to-port 3000
Grafana supports authenticated access and is configured with basic auth out of the box. It also has support for LDAP but we wanted to disable all authentication since it is only running internally. To do this, just un-comment the option in the config file:
 [auth.anonymous]
 # enable anonymous access
-;enabled = true
+enabled = true
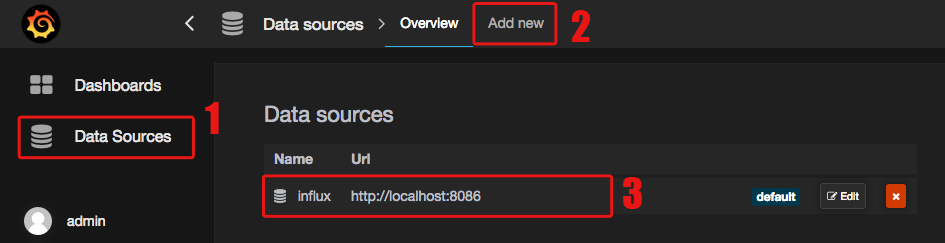
Next you’ll need to add the local InfluxDB as a datasource from which you can query in Grafana:
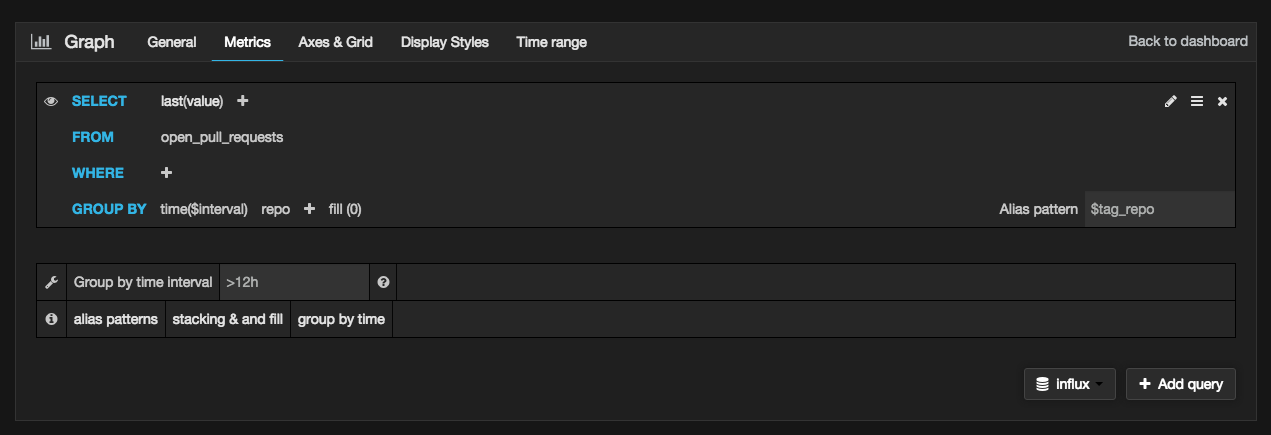
Then it’s just a question of adding graphs using Grafana’s web interface. It echos the query language that you’d use in directly with InfluxDB:
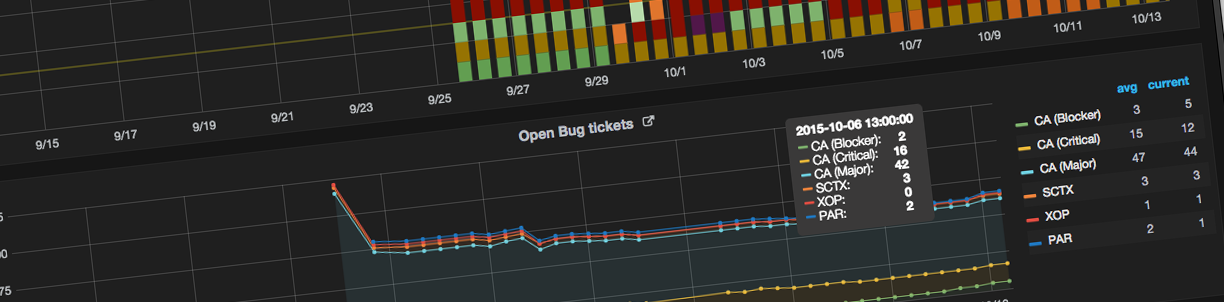
And there you go… “Job’s a good’n” as they say:
Leave a Reply