It’s been a few months now, and our information radiator for our team is humming along nicely.
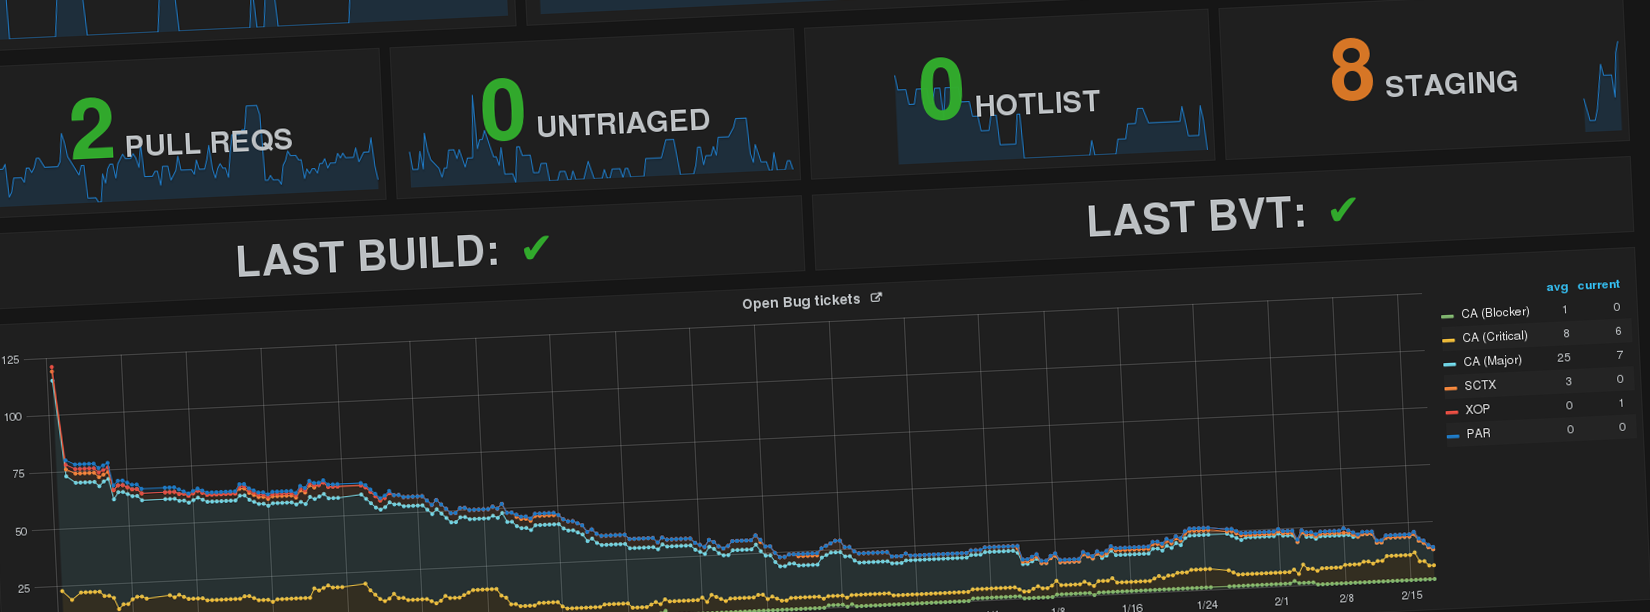
It was fun putting it all together and I blogged about the process of hand crafting the system to our team’s needs.
Since then it’s become quite a popular tool. What was initially meant for our team (both local and remote) to see at a glance how we were doing quickly gained some other uses. It became our launchpad for standups, we’d start here and click through to see the open bugs or the outstanding pull-requests and see our defect landing curves toward the end of our projects. It also became a place where external stakeholders could go and ~keep tabs on us~ track our progress in a digestable way. No more tralling through JIRA; no more losing that pull-request down the back of the sofa of the repo that is rarely touched.
No tool is perfect but this one is useful to us and the plan is to adopt something similar for other teams.
Wait. What?! I carefully stitched this machine together to do all it needed to do. I’d sourced all the packages, configured InfluxDB by hand, pain-stakingly created the Grafana dashboard and written scripts to populate it. I had fallen foul of the pets vs cattle idiom.
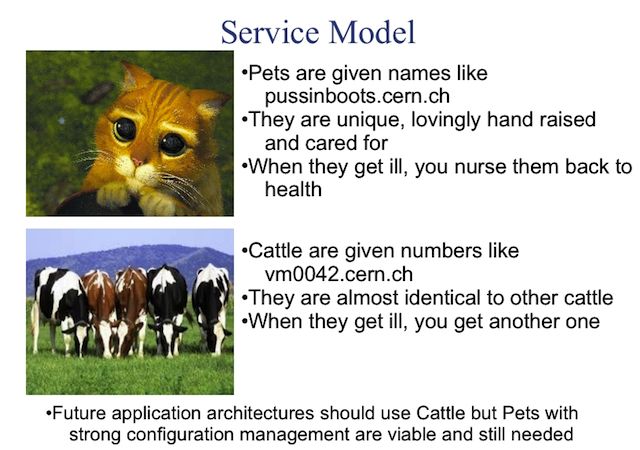
Slide from “CERN Data Centre Evolution”
Enter Docker
Well having failed to do it right and do it once, twice was definitely all I could stomach. Docker3 to the rescue. With Docker, you can define your setup once and deploy it many times with ease. Once you have defined a Docker image, the same image can be used to run as many containers as required.
Here’s what I ended up with: docker-xs-dev-dash.
This repo contains a Dockerfile and supporting bits and pieces to create an image comprising of:
- InfluxDB - time series database
- Grafana - Dashboarding and visualation interface
- nginx - to handle the port forwarding
- cron - to run the scripts
- supervisord - to run all the things
It sets up a persistent data volume container for the contents of the database which allows for the main container to be destroyed, improved and re-deployed.
The ball-ache of bootstrapping
An obvious prerequisite to containerising your deployment is a scriptable way to install all the components. In this regard, not all tools are created equal. Both Grafana and InfluxDB need some level of bootstrapping beyond what can be specified in the config file.
Creating an InfluxDB database
This is one of those things that cannot be driven from a config file. However, where there’s a will there’s a way, and by way I mean API. InfluxDB does expose an API over HTTP and the package contains a CLI that can use this. The only final niggle is that the init script returns from starting the daemon before the daemon is ready to accept connections so we need to fudge the script a bit. The crux of it is:
/etc/init.d/influxdb start
# wait for influxdb to respond to requests
until /opt/influxdb/influx -execute 'show databases'; do sleep 1; done
/opt/influxdb/influx -execute 'create database inforad'
Adding an InfluxDB datasource to Grafana
The Grafana installation needs a bit of tweaking for authentication and to make
use of JSON defined dashboards, most of which can be done using the config
file. However, one thing that cannot be driven from the config file is
connecting Grafana to the InfluxDB datasource. This too has a HTTP API, but
alas no CLI. So we resort to using curl with basic auth (before we inject the
configuration):
/etc/init.d/grafana-server start
curl 'http://admin:admin@localhost:3000/api/datasources' \
    -X POST -H "Content-Type: application/json" \
    --data-binary <<DATASOURCE \
      '{
        "name":"influx",
        "type":"influxdb",
        "url":"http://localhost:8086",
        "access":"proxy",
        "isDefault":true,
        "database":"inforad",
        "user":"n/a","password":"n/a"
      }'
DATASOURCE
/etc/init.d/grafana-server stop
Using a JSON defined Grafana dashboard
The normal way to create dashboards on Grafana is via they’re clicky-clicky web UI. This isn’t what we want if we want to roll-out a container with a pre-canned dashboard. Fortunately you can have Grafana load dashboards from JSON files. This option is disabled by default but can be enabled in the grafana config file:
[dashboards.json]
enabled = true
path = /var/lib/grafana/dashboards/
Persistent storage
What good is a database that won’t keep hold of your data? What we want is to be able to iterate development on this container, allowing us to track different metrics or tweak the dashboard layout, without nuking the data from the InfluxDB database. To solve this we use a “Data Voume Container”. There seems to be a fashion for using some other “minimal” OS container for this purpose (e.g. busybox) to save on space but this isn’t the optimal solution. Unless you already had this docker image for some other purpose then you’ll require another docker image for this data volume container. Given the use of the union filesystem in Docker, the most efficient way of creating this data volume container is to reuse your application image.
To do this we make sure the image is defined to expose the volume we’re interested in by defining it in our Dockerfile:
VOLUME /var/opt/influxdb/
Now we run a new container but specify a different command. /bin/true is
fine, just something to create the container:
$ docker run --name=dash-data -ti dash-img true
We can now run our main container using --volumes-from so that the InfluxDB
process that runs in the container will have it’s data persisted because it is
written to the data volume container. Note, we can also happily use --rm when
running the main container since we don’t need to persist any state from it.
$ docker run --name=dash --rm -ti \
  --volumes-from=dash-data -p 80:80 \
  dash-img
Should you need to access the data in the data volume container you can do so by creating a third container and invoking a shell. You may also need to pre-populate the data container and you can do this by also mounting in a directory from your host as an additional volume:
$ docker run --name=dash-shell --rm -ti \
  --volumes-from=dash-data \
  -v $(pwd)/data-backup:/host-data-backup \
  dash-img /bin/bash
Running multiple processes with supervisord
This is a bit of a break from the proposed model of Docker where you would
isolate all the individual applications in separate containers. Any shared
storage would be done using a data volume container as above and any network
access can be done using --link when running the individual containers.
This does mean you have to maintain mutliple containers and also that any configuration changes are done in lock-step. This can add complexity to the development of the overall application. Docker also provide good support for deploying multi-container applications in this way using Docker Compose but, for simplicity, I decided to keep everything in the one container.
The other popular approach is to use supervisord to run several processes
in one container. This then becomes the default CMD for the Docker image:
CMD ["/usr/bin/supervisord"]
The installed packages were intended to be run by systemd. So we can grab the
runes needed to run them with the correct parameters from their .service
files:
$ rpm -qlp influxdb-0.9.4-1.x86_64.rpm | grep service
/opt/influxdb/versions/0.9.4/scripts/influxdb.service
$ rpm -qlp grafana-2.1.3-1.x86_64.rpm | grep service
/usr/lib/systemd/system/grafana-server.service
The resulting supervisord.conf also spins up nginx and crond and
handles autorestarting processes.
The Dockerfile and the Docker build cache
Ideally I’d like to have kept all the Grafana configuration files and bootstrapping with the installation of the Grafana package in my Dockerfile (similarly for the other packages). However, things like the Grafana dashboard JSON definition and the scripts to generate the data are likely to change as we change what data we track. For this reason we need to keep them at the end of the Dockerfile resulting in the stable commands at the top and the more volatile ones nearer the bottom. This way we won’t invalidate the Docker build cache for, say installing nginx, when we change the Grafana config.
Packaging
Probably the next step is to point the Docker Hub cannon at the repo and have
it build the image and host it on the Docker Hub allowing people to docker
pull and get going. For the time being we’re driving this all from a
Makefile, mainly for the benefit of bootstrapping and protecting the data
volume container by ensuring only one container runs with the volumes from the
data container at any one time.
Check out how to build @docker images for Grafana & InfluxDB over on @simonjbeaumont's blog: https://t.co/VzDQhEhnTM pic.twitter.com/xMlwtTis7H
— InfluxData (@InfluxDB) February 19, 2016
Leave a Reply